

 Documentation
 Instrumentation
 Guides
 API Reference
 Changelog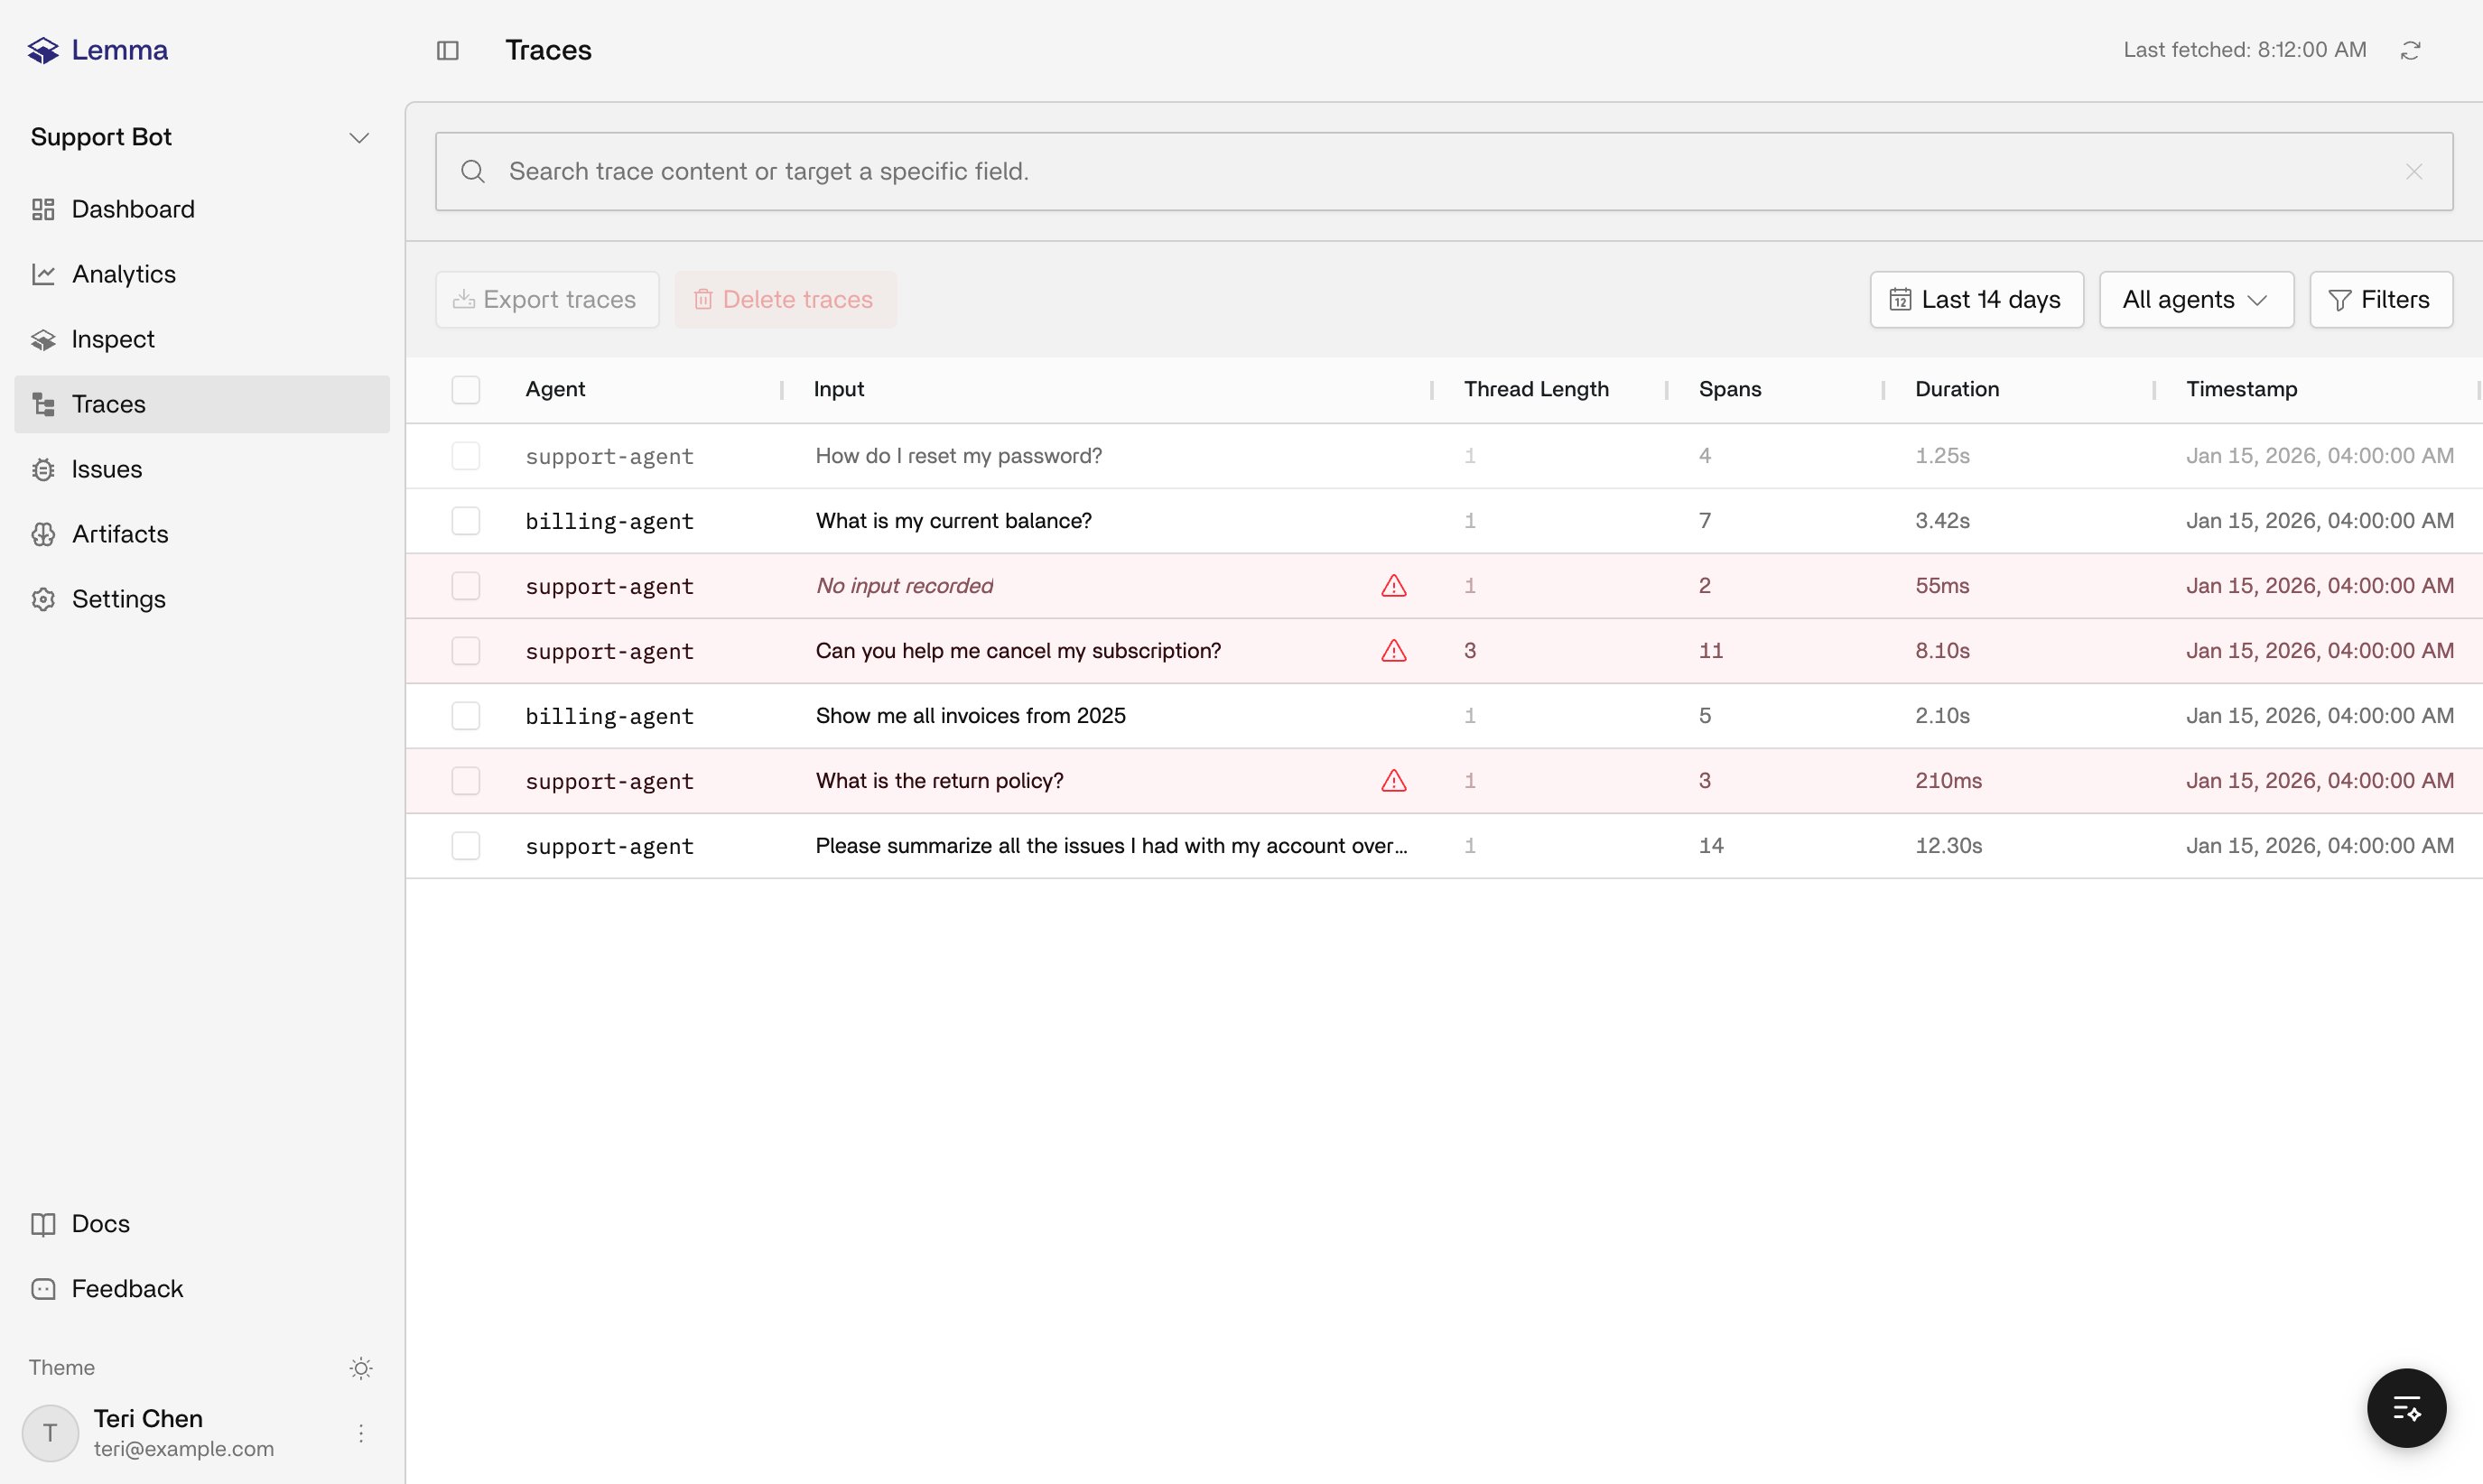
What a row is
Each row is one ready agent execution, meaning one conversation turn. Columns include time, agent, duration, span count, an input preview, and separate marks for errors and issues. Traces stay on this list for 14 days before they age out. Agent, release, user, and thread aren’t separate dashboards; they’re attributes on the trace that come from your SDK context. Filter or search on those fields directly, and see Threads and context for how to set them. SDKmetadata and attributes both land as searchable span attributes after ingest.
Search and filters
You can combine several filters at once:- Full-text or structured search, with saved searches
- Time range, absolute or relative
- Agent name
- Duration, span count, token count, error state, and issue state
- Attribute filters, for example
user.uidif you recorded it
Opening a trace
The detail view, whether a drawer or a dedicated page, has two panels that answer different questions. Conversation shows the user and assistant turns as a readable thread, and if traces share a thread ID, stitches multiple turns into one conversation. Execution tree shows the nested spans, generations, tool calls, and other work, each with timing, input and output, and any errors. Read the conversation to see what the person using the agent experienced, and the tree to find which tool or model call actually failed. Issues Lemma observed in that run appear on the trace so you can open them.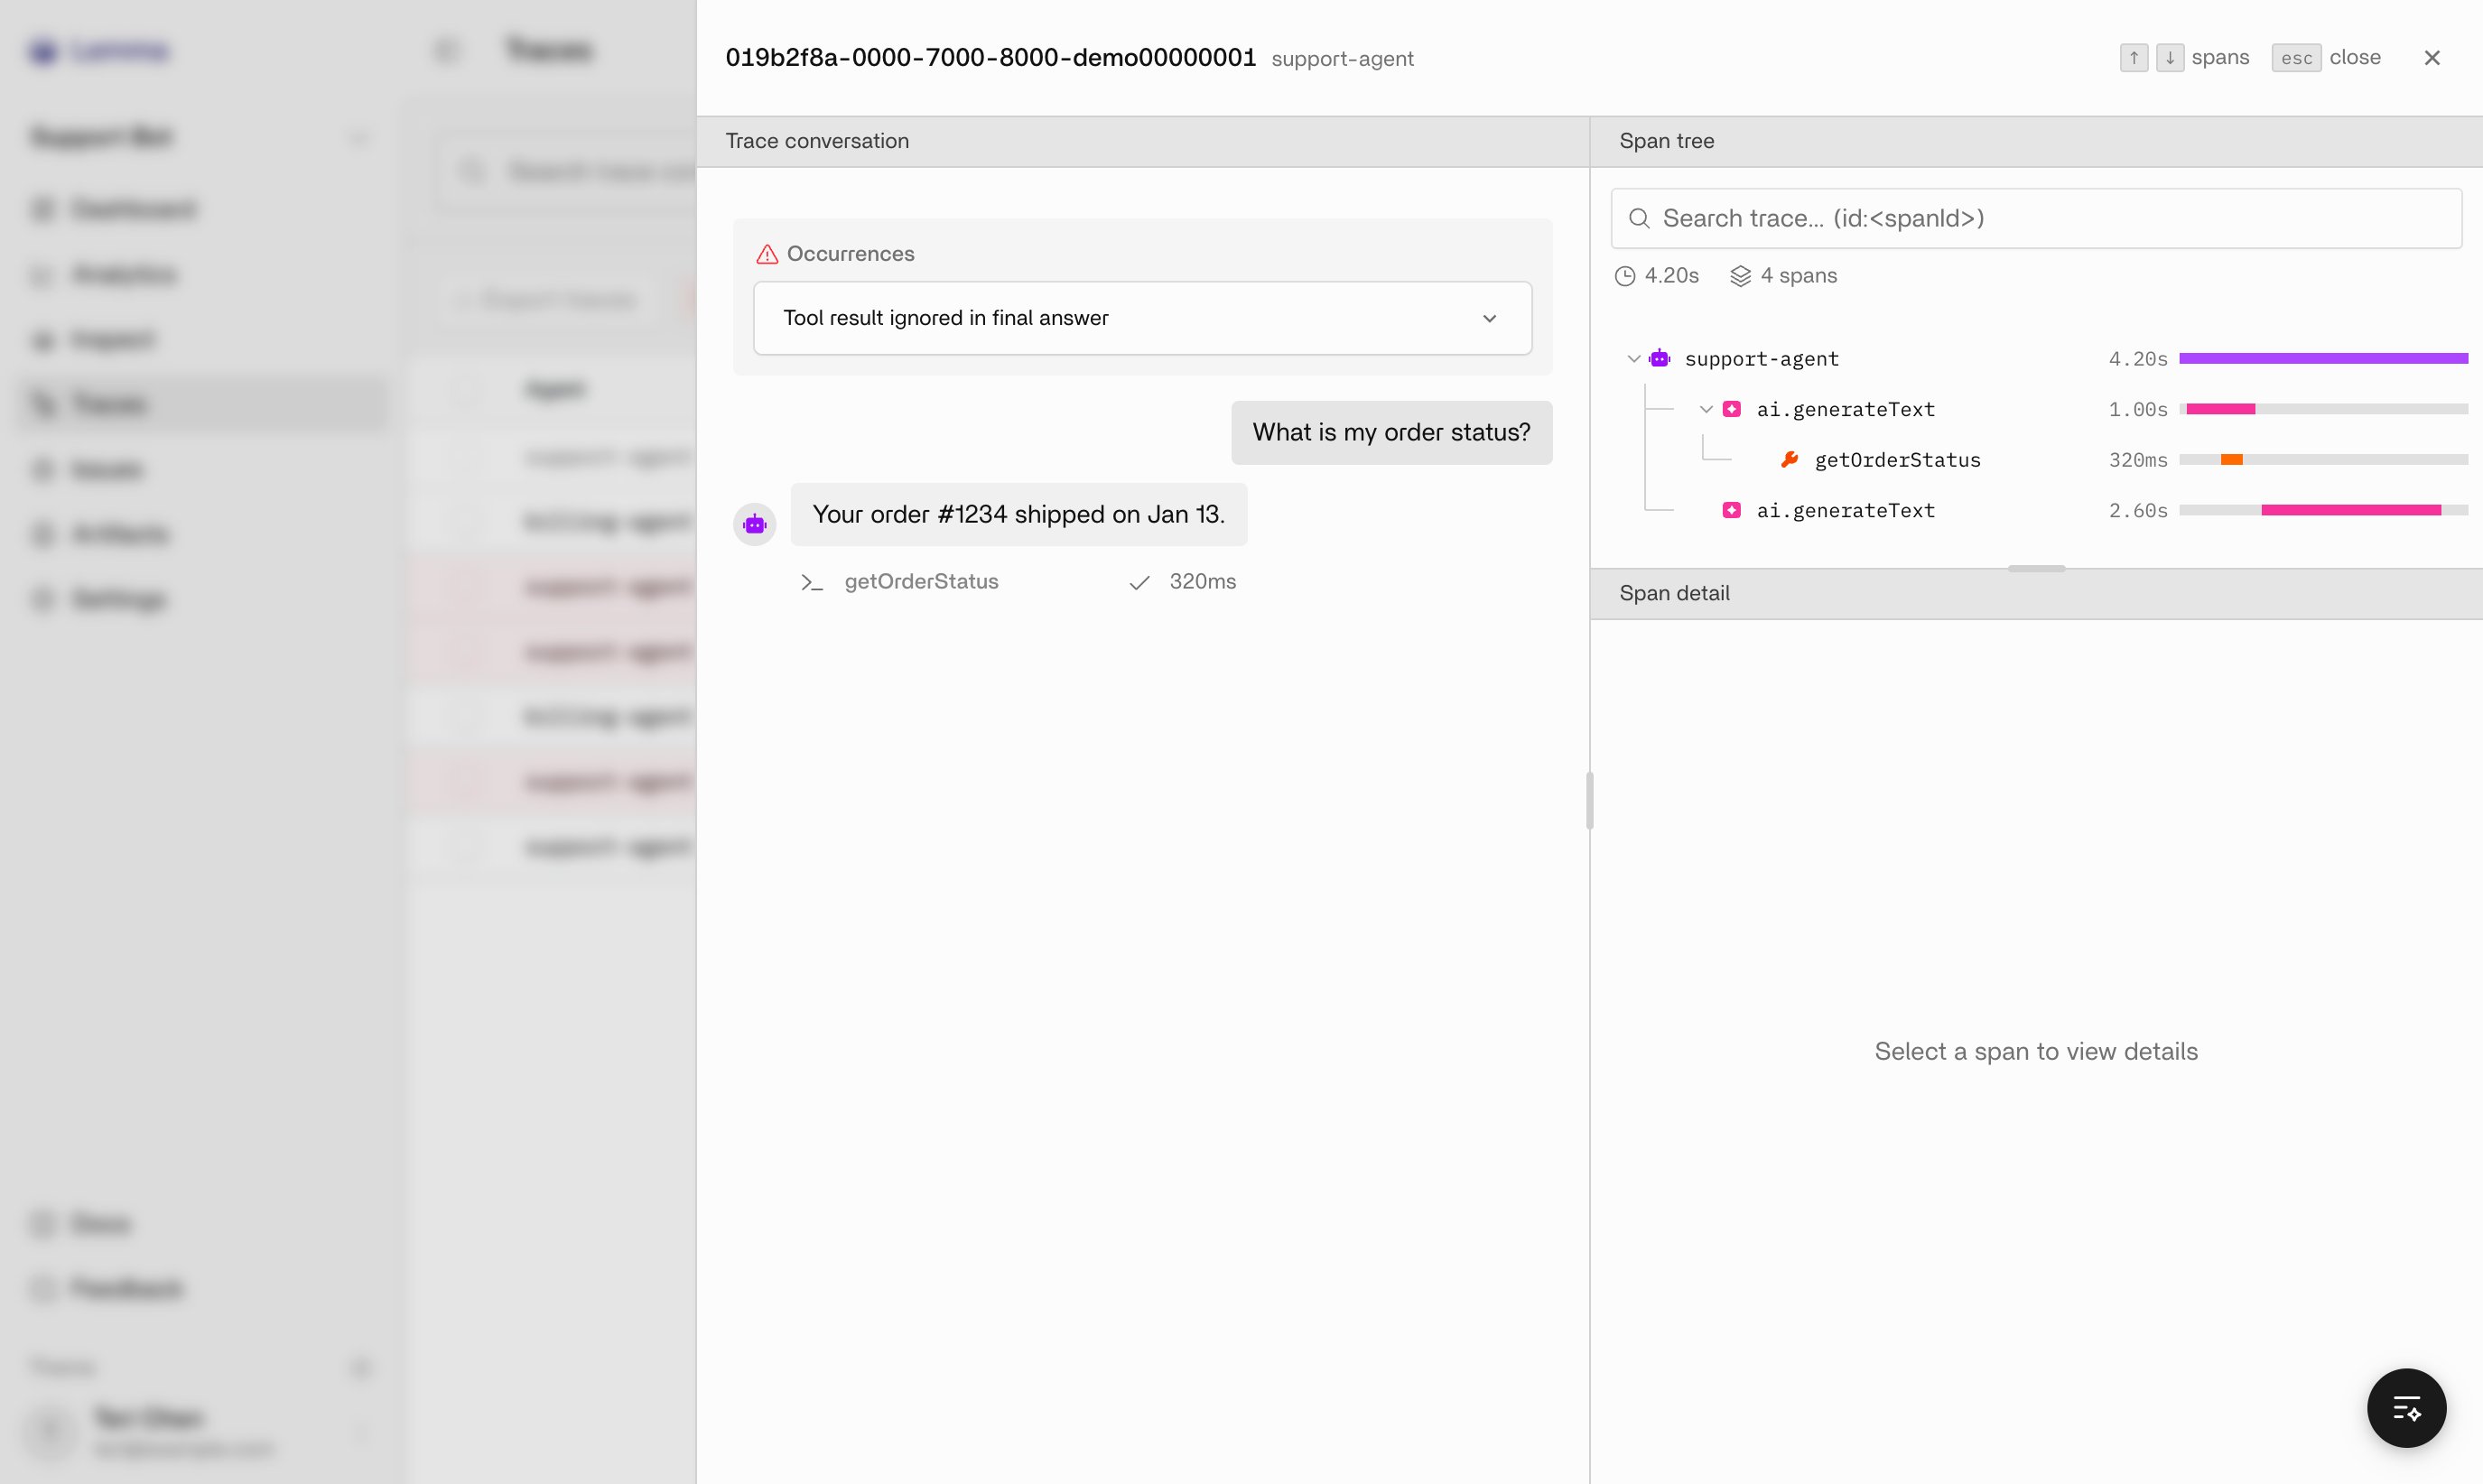
From traces to the rest of the product
An issue mark means extraction grouped this run into a failure pattern; open Issues to see its status and every other supporting trace. An error mark means a span or the root failed, which may or may not turn into an issue. From an open trace, ask Inspect to explain the flagged issue or find other traces like it. When you need the aggregate view across many traces rather than one execution, that’s Analytics.Related pages
Overview
How traces become issues after they arrive.
Issues
Grouped failure patterns across many traces.
Inspect
Ask questions about the trace you have open.
Agent traces
How to create a root trace in the SDK.