

 Documentation
 Instrumentation
 Guides
 API Reference
 Changelog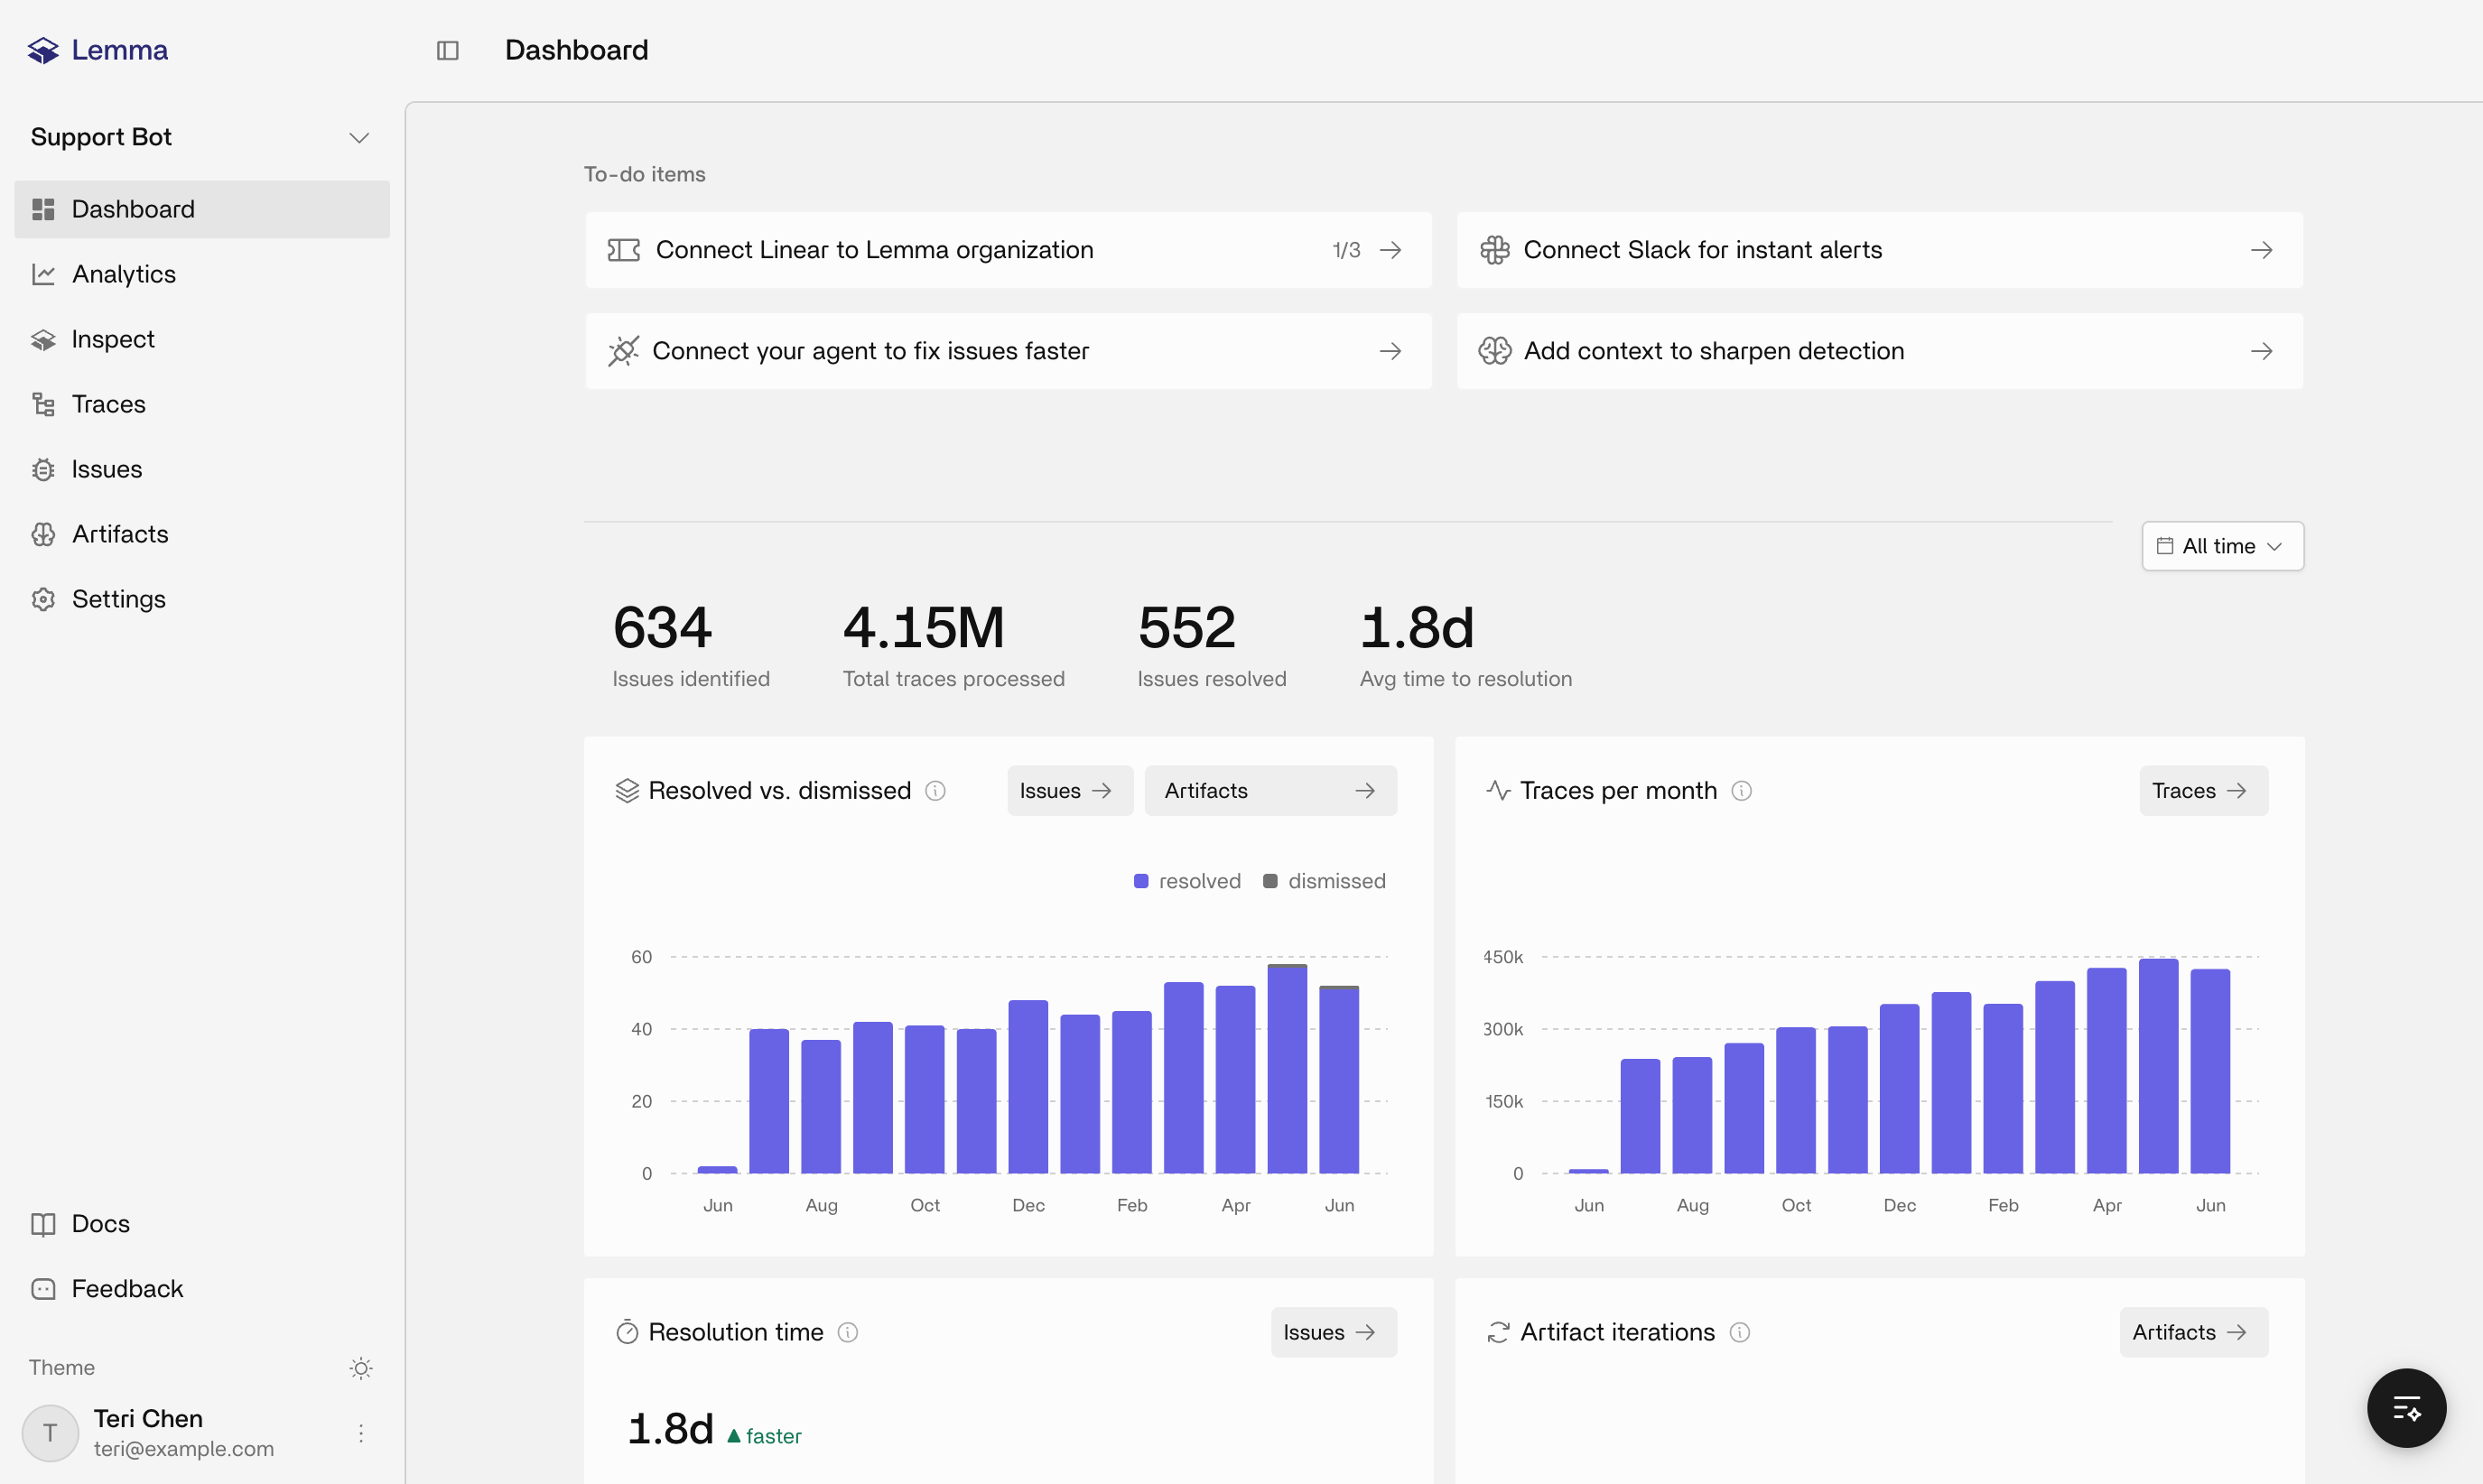
- Instrument the production agent so each execution becomes a ready, inspectable trace.
- Analyze completed traces for behavior that materially hurt the agent’s task.
- Group repeated evidence into an issue.
- Investigate in the dashboard, Inspect, Slack, Linear, or a coding agent. See Turning issues into fixes.
Start sending traces
Choose how you’ll send agent data to Lemma.Quickstart
Send your first complete agent trace to Lemma.
Integrations
Trace agents built with OpenAI Agents, Vercel AI SDK, LangChain, LangGraph, or Mastra.
Core concepts
Learn how Lemma defines traces, spans, generations, and threads.
Overview
What to do after the first ready trace arrives.
Investigate and fix failures
Use Lemma to review detected failures, receive alerts, and investigate from your editor.Turning issues into fixes
Triage a production issue, inspect the evidence, ship a change, and confirm it does not recur.
Issues
Review recurring failures that Lemma detects across your agent traces.
Inspect
Ask questions about the trace, issue, or page you are on.
Slack
Receive issue alerts and optional Issue Briefs in Slack.
Lemma MCP server
Give your coding agent the traces and issues it needs to investigate a failure.