> ## Documentation Index
> Fetch the complete documentation index at: https://docs.uselemma.ai/llms.txt
> Use this file to discover all available pages before exploring further.
# Overview
> How Lemma turns a trace into an issue, and where projects and agents fit
Lemma turns each agent execution into a trace, finds the executions that went wrong, and groups the repeat offenders into issues you can triage. This page walks through that path end to end: how a trace becomes an issue, how projects and agents relate to each other, and which dashboard surface to open at each step.
For the SDK vocabulary (trace, span, generation, tool call, thread, project), see [SDK concepts](/tracing/instrumentation/concepts). For the dashboard vocabulary (issues, occurrences, artifacts, agents), see [Platform concepts](/platform/concepts). To send your first trace, see [Quickstart](/tracing/instrumentation/setup).
 ## How a trace becomes an issue
An instrumented agent emits one trace per execution, or per conversation turn when you set a thread ID. See [Concepts](/platform/concepts) for how Lemma turns that trace into an issue — the detection timing, the probabilistic grouping, and the vocabulary for both.
Once an issue exists, you investigate it in the dashboard or through Inspect, then resolve, dismiss, or route it to Slack, Linear, MCP, or webhooks.
## Projects and agents
You create projects to isolate traces by environment (dev, staging, prod) or product line; each has its own dashboard, API key, and settings. Agents aren't registered the same way — see [Concepts](/platform/concepts) for how a trace's agent name scopes Artifacts, Analytics, and issue grouping.
## The dashboard surfaces
Each surface below answers a different question about the same underlying traces:
| Surface | What it's for |
| ------------------------------------ | ---------------------------------------------------------------------------------------------------------------------------------------------------------------------------------------- |
| **[Traces](/platform/traces)** | Search, filter, and open individual executions and threads. Distinct from the instrumentation [Agent traces](/tracing/instrumentation/traces) page, which explains how to create traces. |
| **[Issues](/platform/issues)** | Recurring failure patterns with occurrences, status, and evidence. |
| **[Inspect](/platform/inspect)** | An in-product assistant that reads the page you're on (a trace, an issue, Analytics, Artifacts, settings) and can share conversations. |
| **[Artifacts](/platform/artifacts)** | Per-agent context you provide, plus Lemma's generated understanding document and decision-flow diagram. |
| **[Analytics](/platform/analytics)** | Project-level volume, latency, errors, tools, models, and cost over a timeframe. Feature-gated; may not appear in your workspace yet. |
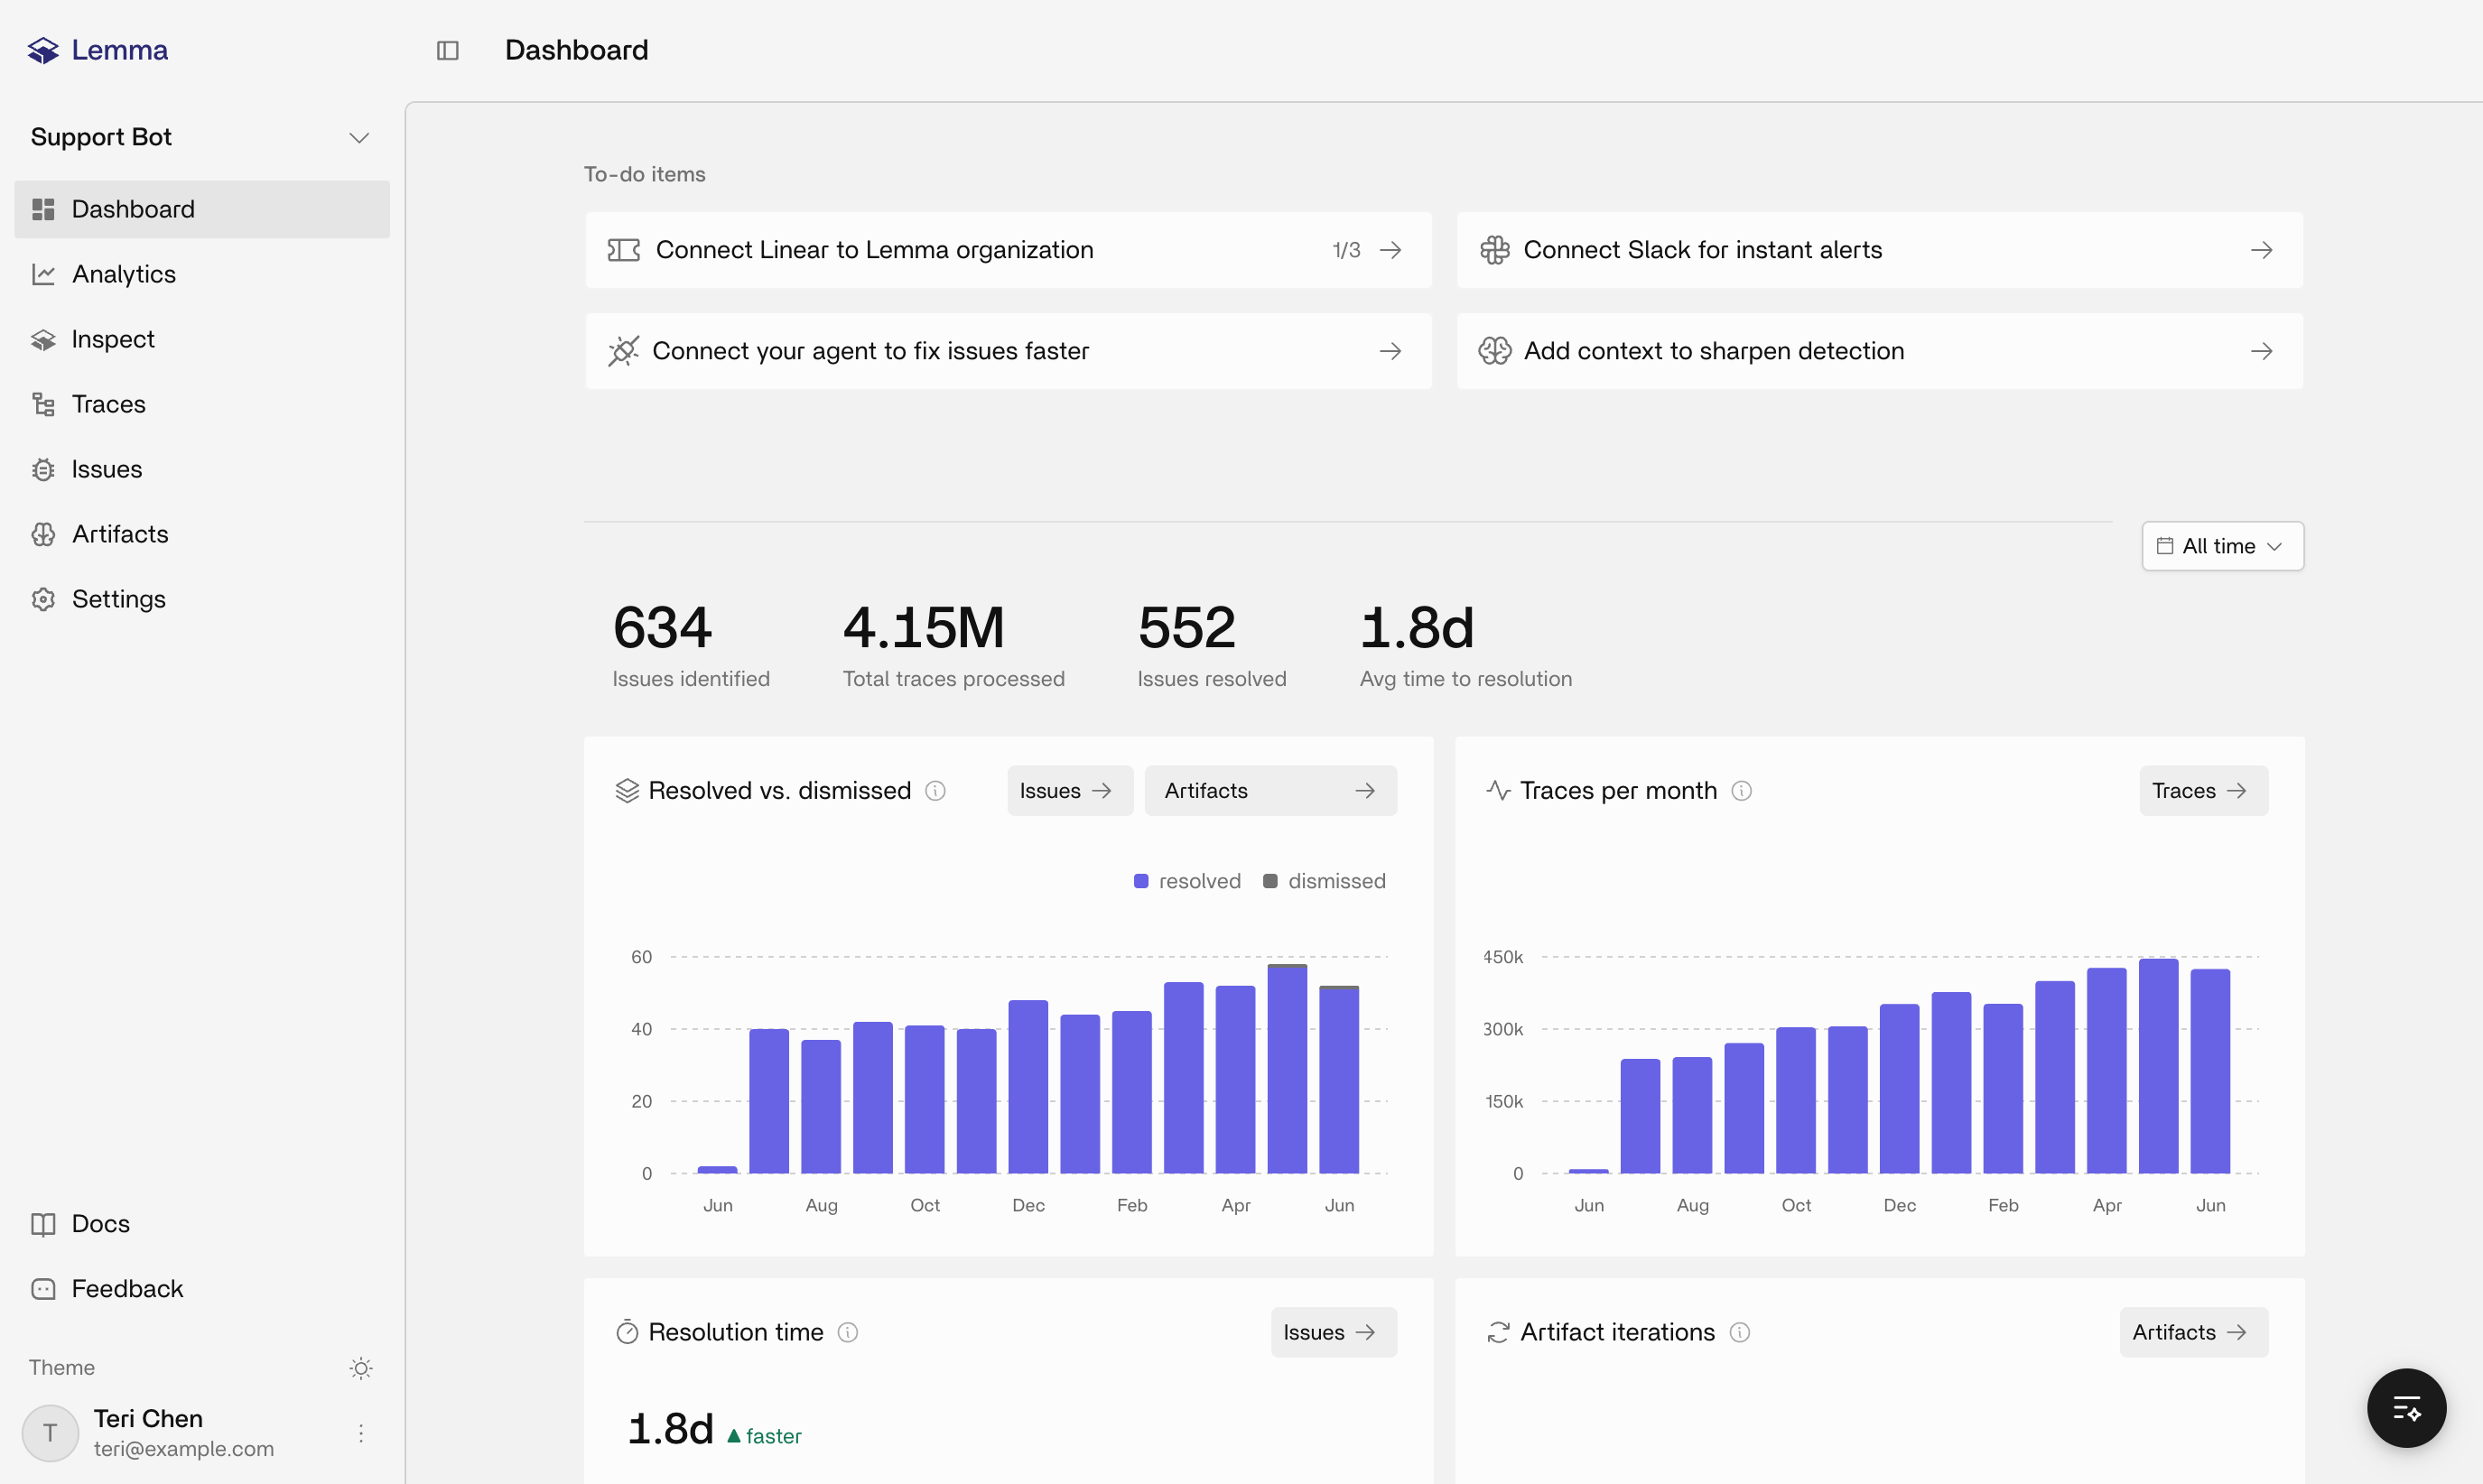
A typical investigation starts on Analytics or Issues, where you spot a trend. From there you open the supporting traces, ask Inspect what's going on, add Artifacts context if detection missed the mark, and alert or ticket the finding through [Connections](/connections/overview).
## What to do after the first trace
1. Open **[Traces](https://platform.uselemma.ai)** in the project and confirm the execution tree and conversation look complete.
2. Wait for issues if the conversation is still active. Extraction runs after a thread goes quiet, or immediately when there's no thread ID.
3. Add [Artifacts](/platform/artifacts) context for that agent if domain rules matter to how you'd judge a run.
4. Connect Slack, Linear, the MCP server, or webhooks once the team needs those paths. See [Connect your workflow](/connections/overview).
## Related pages
Traces, issues, occurrences, artifacts, and agents.
Project-level volume, latency, errors, tools, models, and cost.
Ask questions about the trace, issue, or page you're on.
Search and inspect ready executions in the dashboard.
Recurring failure patterns with status and evidence.
Per-agent context, understanding document, and decision-flow diagram.
Slack, Linear, MCP Server, and webhooks.
## How a trace becomes an issue
An instrumented agent emits one trace per execution, or per conversation turn when you set a thread ID. See [Concepts](/platform/concepts) for how Lemma turns that trace into an issue — the detection timing, the probabilistic grouping, and the vocabulary for both.
Once an issue exists, you investigate it in the dashboard or through Inspect, then resolve, dismiss, or route it to Slack, Linear, MCP, or webhooks.
## Projects and agents
You create projects to isolate traces by environment (dev, staging, prod) or product line; each has its own dashboard, API key, and settings. Agents aren't registered the same way — see [Concepts](/platform/concepts) for how a trace's agent name scopes Artifacts, Analytics, and issue grouping.
## The dashboard surfaces
Each surface below answers a different question about the same underlying traces:
| Surface | What it's for |
| ------------------------------------ | ---------------------------------------------------------------------------------------------------------------------------------------------------------------------------------------- |
| **[Traces](/platform/traces)** | Search, filter, and open individual executions and threads. Distinct from the instrumentation [Agent traces](/tracing/instrumentation/traces) page, which explains how to create traces. |
| **[Issues](/platform/issues)** | Recurring failure patterns with occurrences, status, and evidence. |
| **[Inspect](/platform/inspect)** | An in-product assistant that reads the page you're on (a trace, an issue, Analytics, Artifacts, settings) and can share conversations. |
| **[Artifacts](/platform/artifacts)** | Per-agent context you provide, plus Lemma's generated understanding document and decision-flow diagram. |
| **[Analytics](/platform/analytics)** | Project-level volume, latency, errors, tools, models, and cost over a timeframe. Feature-gated; may not appear in your workspace yet. |
A typical investigation starts on Analytics or Issues, where you spot a trend. From there you open the supporting traces, ask Inspect what's going on, add Artifacts context if detection missed the mark, and alert or ticket the finding through [Connections](/connections/overview).
## What to do after the first trace
1. Open **[Traces](https://platform.uselemma.ai)** in the project and confirm the execution tree and conversation look complete.
2. Wait for issues if the conversation is still active. Extraction runs after a thread goes quiet, or immediately when there's no thread ID.
3. Add [Artifacts](/platform/artifacts) context for that agent if domain rules matter to how you'd judge a run.
4. Connect Slack, Linear, the MCP server, or webhooks once the team needs those paths. See [Connect your workflow](/connections/overview).
## Related pages
Traces, issues, occurrences, artifacts, and agents.
Project-level volume, latency, errors, tools, models, and cost.
Ask questions about the trace, issue, or page you're on.
Search and inspect ready executions in the dashboard.
Recurring failure patterns with status and evidence.
Per-agent context, understanding document, and decision-flow diagram.
Slack, Linear, MCP Server, and webhooks.