> ## Documentation Index
> Fetch the complete documentation index at: https://docs.uselemma.ai/llms.txt
> Use this file to discover all available pages before exploring further.
# Inspect
> Ask Lemma about this project's traces, issues, artifacts, and settings
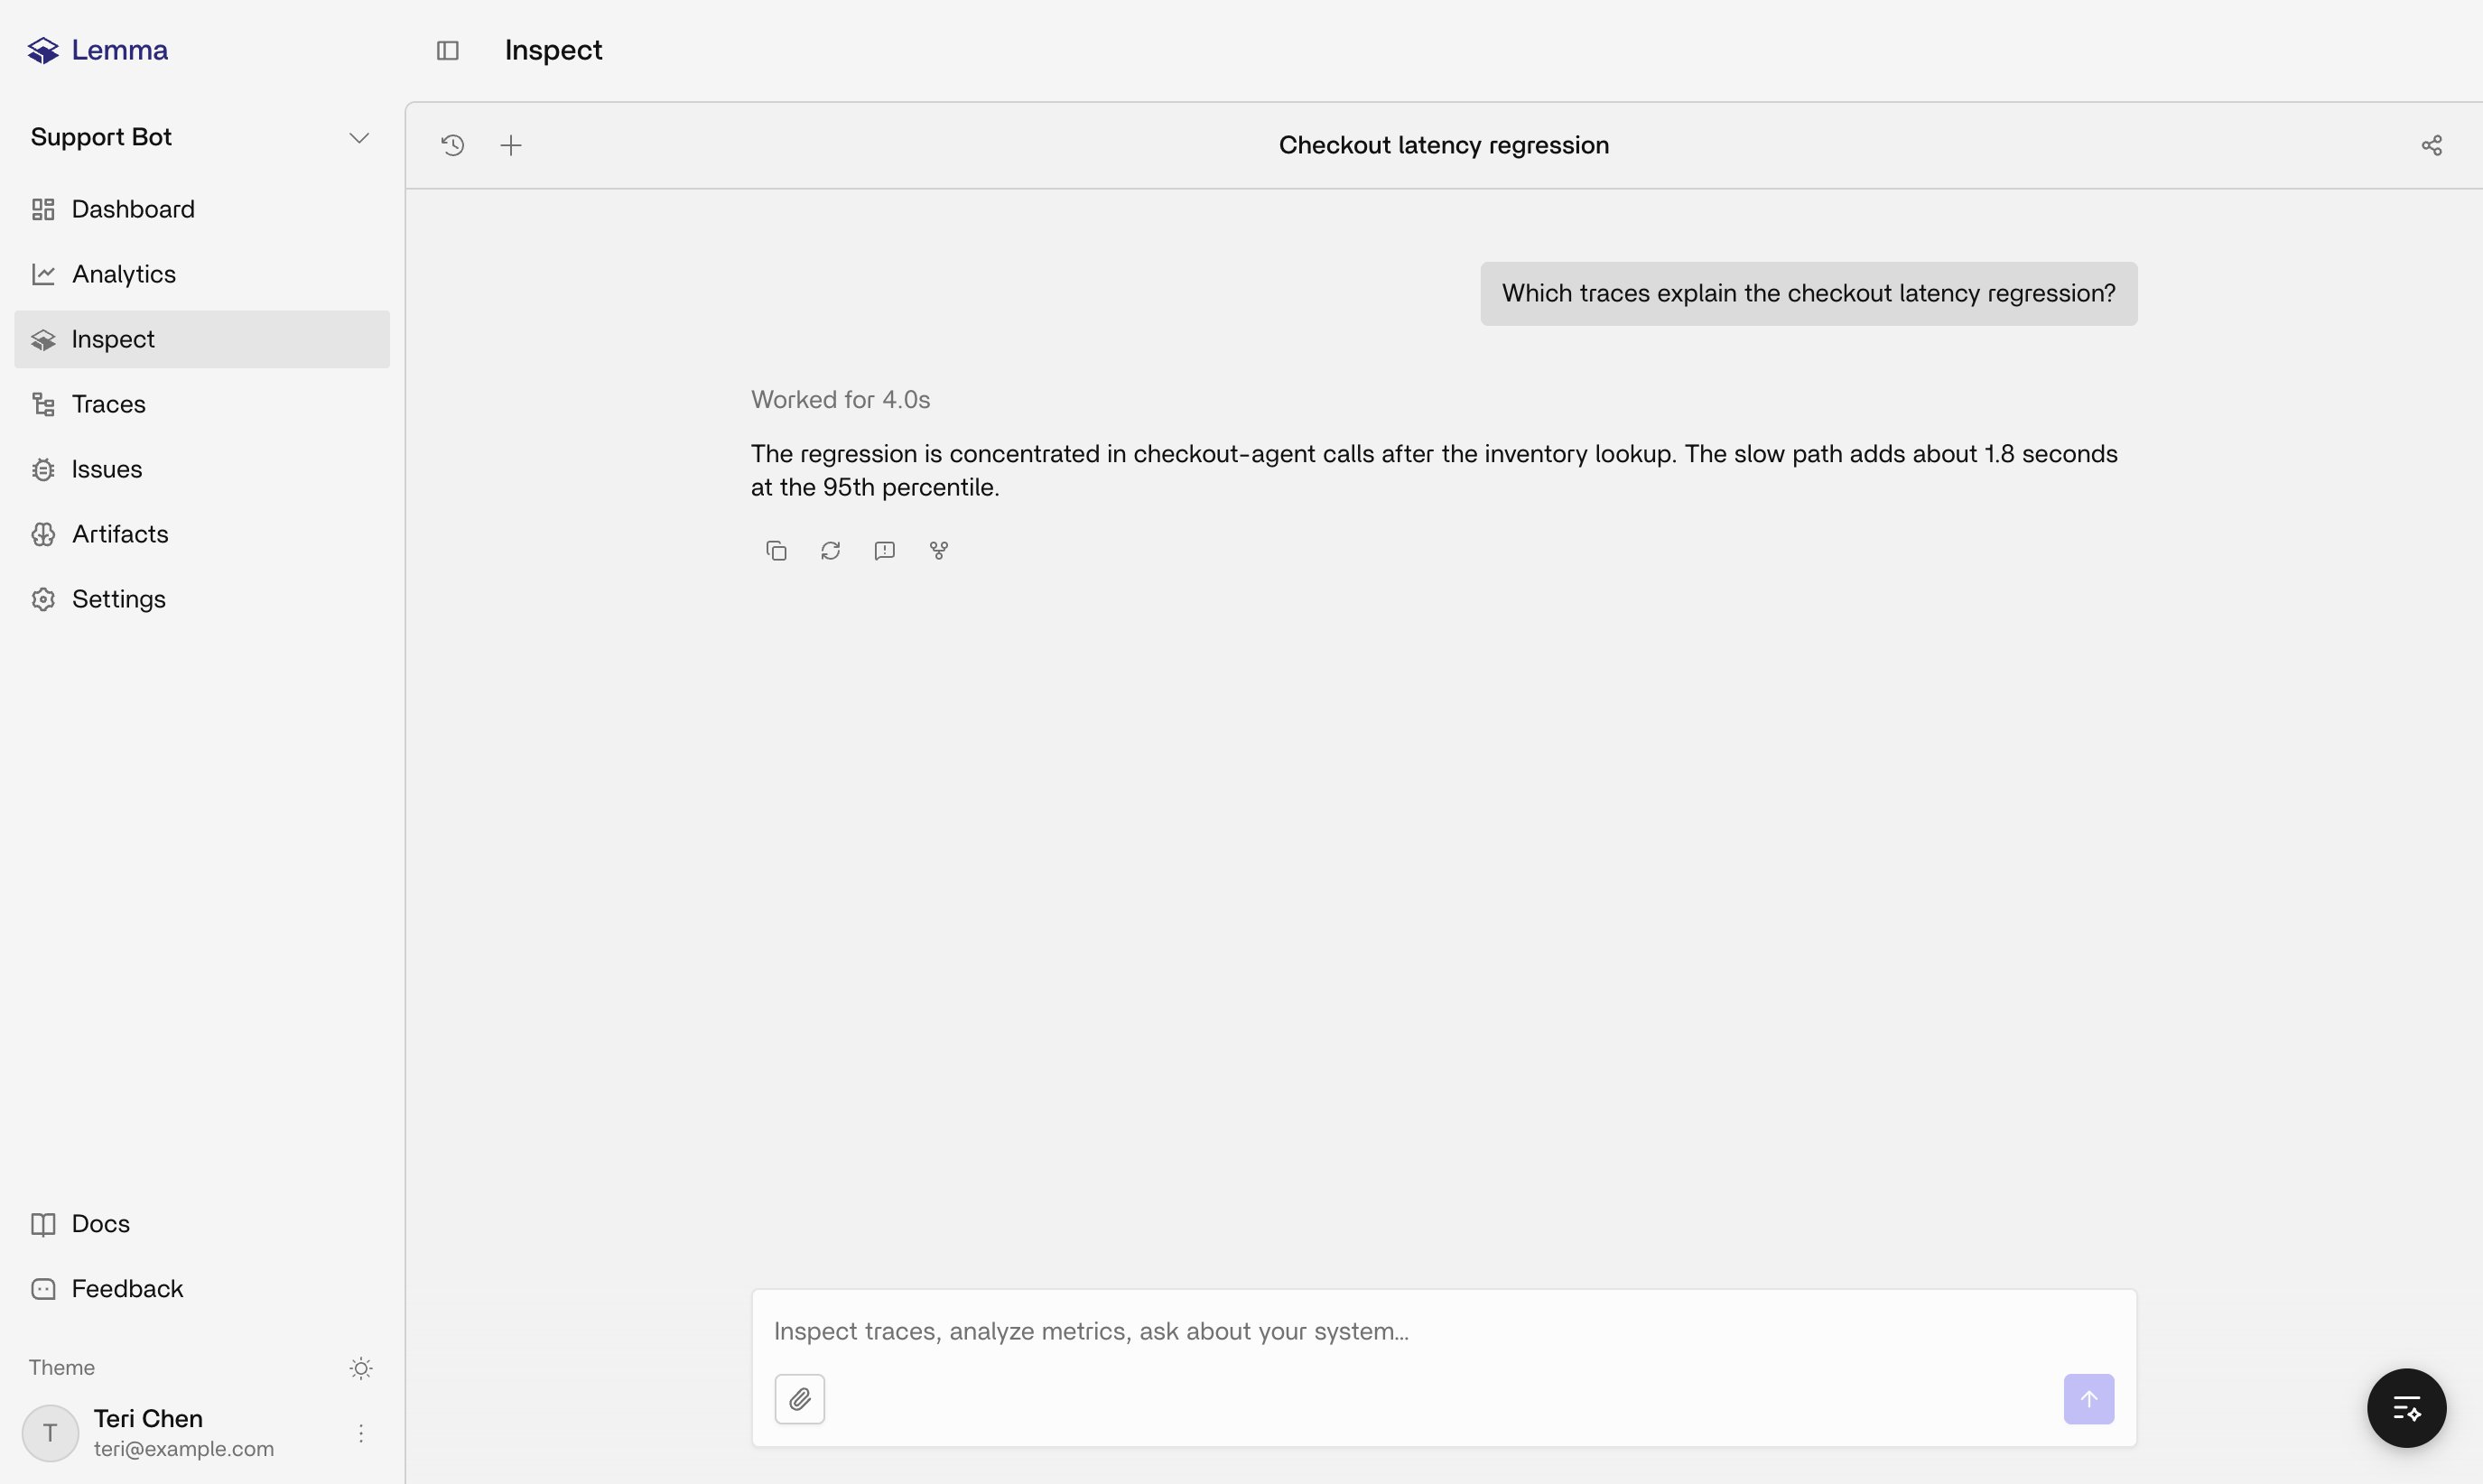
Inspect is Lemma's in-product assistant. It answers from this project's own traces, issues, artifacts, and settings, not from a generic model of your codebase, so ask it questions you'd otherwise dig through the dashboard to answer. When you need to scan, filter, or change status yourself, use [Traces](/platform/traces) or [Issues](/platform/issues) instead. Open the project's **Inspect** page in the [Lemma dashboard](https://platform.uselemma.ai), or the Inspect widget available from other project pages.
 ## Where it runs
Inspect appears in two places with the same durable conversation model: the full-page **Inspect** view for the project, and an **Inspect widget** that overlays other project pages.
Inspect is page-aware. It reads context from the URL, and from an open trace drawer, so you can say "this issue" or "this trace" without pasting an ID:
| You're on | Inspect treats as |
| ----------------------------------- | ---------------------------------- |
| A specific issue | That issue |
| A specific trace, or a trace drawer | That trace |
| Traces list, no trace open | Project traces, list-level prompts |
| Issues list, no issue open | Project issues, triage prompts |
| Analytics | The Analytics window from the URL |
| Artifacts | The selected agent |
| Settings | Setup and integration how-tos |
An open trace drawer takes priority over the issue URL underneath it, so Inspect talks about the trace you're viewing, not the issue page behind it.
## What it can read, explain, or change
Inspect reads and explains project evidence: traces, issues, Artifacts (the understanding document, the diagram, and whatever context you provided), Analytics windows, and how Slack, Linear, MCP, and webhooks are meant to be set up. It's grounded in Lemma's actual product surface — see [Concepts](/platform/concepts) for what that surface does and doesn't include — so it won't invent features Lemma doesn't have.
Inspect doesn't replace the system of record. Issue status, Linear linking, and webhook configuration still live on Issues and Settings; Inspect can explain them but not change them on your behalf. It never returns secret values like API keys, Slack tokens, MCP credentials, or webhook signing secrets, pointing you to the UI or your secret manager instead. And it treats setup status as a snapshot: documentation or a configured URL isn't proof that this specific project finished setup.
Within a conversation, your permissions determine what you can do: edit a turn, regenerate a response, fork the conversation, share it with organization members, report a bad response, or rename and delete it. Sharing stays scoped to your organization, not a public unauthenticated URL.
## History, attachments, and new chats
Conversations persist, so open **history** to resume one instead of starting over. Start a **new chat** when the topic changes rather than dragging Inspect through an unrelated thread. Attach the current page (a trace or an artifact, for example) so Inspect is looking at the same object you are, and know that shared conversations show up in the shared history for any member you granted access to.
## Suggested questions by page
The UI swaps in page-specific prompts where it has them; until then, these work everywhere:
* **A trace**: why was this run flagged, and are there other traces with the same issue?
* **An issue**: why did this fire, what scenarios triggered it, and how do I fix it?
* **Issues list**: what should I look at first, and what's the impact?
* **Traces list**: where are users frustrated, confused, or asking for a human?
* **Artifacts**: what does this agent do, what's its decision flow, and what context should I add?
* **Settings**: how do I connect Slack, alert on new issues, or see which integrations exist?
## Related pages
How dashboard surfaces fit together after traces arrive.
Search and open individual executions.
Recurring failure patterns with evidence.
Investigate the same project from a coding agent instead of the dashboard.
## Where it runs
Inspect appears in two places with the same durable conversation model: the full-page **Inspect** view for the project, and an **Inspect widget** that overlays other project pages.
Inspect is page-aware. It reads context from the URL, and from an open trace drawer, so you can say "this issue" or "this trace" without pasting an ID:
| You're on | Inspect treats as |
| ----------------------------------- | ---------------------------------- |
| A specific issue | That issue |
| A specific trace, or a trace drawer | That trace |
| Traces list, no trace open | Project traces, list-level prompts |
| Issues list, no issue open | Project issues, triage prompts |
| Analytics | The Analytics window from the URL |
| Artifacts | The selected agent |
| Settings | Setup and integration how-tos |
An open trace drawer takes priority over the issue URL underneath it, so Inspect talks about the trace you're viewing, not the issue page behind it.
## What it can read, explain, or change
Inspect reads and explains project evidence: traces, issues, Artifacts (the understanding document, the diagram, and whatever context you provided), Analytics windows, and how Slack, Linear, MCP, and webhooks are meant to be set up. It's grounded in Lemma's actual product surface — see [Concepts](/platform/concepts) for what that surface does and doesn't include — so it won't invent features Lemma doesn't have.
Inspect doesn't replace the system of record. Issue status, Linear linking, and webhook configuration still live on Issues and Settings; Inspect can explain them but not change them on your behalf. It never returns secret values like API keys, Slack tokens, MCP credentials, or webhook signing secrets, pointing you to the UI or your secret manager instead. And it treats setup status as a snapshot: documentation or a configured URL isn't proof that this specific project finished setup.
Within a conversation, your permissions determine what you can do: edit a turn, regenerate a response, fork the conversation, share it with organization members, report a bad response, or rename and delete it. Sharing stays scoped to your organization, not a public unauthenticated URL.
## History, attachments, and new chats
Conversations persist, so open **history** to resume one instead of starting over. Start a **new chat** when the topic changes rather than dragging Inspect through an unrelated thread. Attach the current page (a trace or an artifact, for example) so Inspect is looking at the same object you are, and know that shared conversations show up in the shared history for any member you granted access to.
## Suggested questions by page
The UI swaps in page-specific prompts where it has them; until then, these work everywhere:
* **A trace**: why was this run flagged, and are there other traces with the same issue?
* **An issue**: why did this fire, what scenarios triggered it, and how do I fix it?
* **Issues list**: what should I look at first, and what's the impact?
* **Traces list**: where are users frustrated, confused, or asking for a human?
* **Artifacts**: what does this agent do, what's its decision flow, and what context should I add?
* **Settings**: how do I connect Slack, alert on new issues, or see which integrations exist?
## Related pages
How dashboard surfaces fit together after traces arrive.
Search and open individual executions.
Recurring failure patterns with evidence.
Investigate the same project from a coding agent instead of the dashboard.