> ## Documentation Index
> Fetch the complete documentation index at: https://docs.uselemma.ai/llms.txt
> Use this file to discover all available pages before exploring further.
# Analytics
> Project-level volume, latency, errors, tools, models, and estimated cost
Analytics charts volume, latency, errors, tools, models, and estimated cost for every trace in a project over a chosen window. Use it to spot a trend, then jump to the traces or issues behind it. Open it from a project in the [Lemma dashboard](https://platform.uselemma.ai).
 ## Timeframes and granularity
Pick a window: all time (clamped to the Analytics horizon), this week, this month, this quarter, this year, or a custom range. Lemma buckets the charts by day, week, or month, defaulting to whatever keeps them readable: day for a week or month window, week for a quarter, month for a year or all time.
Analytics only looks back 90 days on a rolling basis, so older data won't show even if you pick all time. Individual traces on the [Traces](/platform/traces) list are retained for 14 days, which means a chart point can represent a day whose raw traces have already aged out of that list. Use Analytics to see the trend and Traces to open the executions you can still read.
## Project and agent scope
Analytics is project-scoped, and the agent scorecard lists every agent that appeared in the window. Agent names come from the traces themselves, not from a registry you maintain elsewhere, so a missing agent means it didn't emit ready traces in this project and window, not that someone deleted it from a catalog.
## What the surface shows
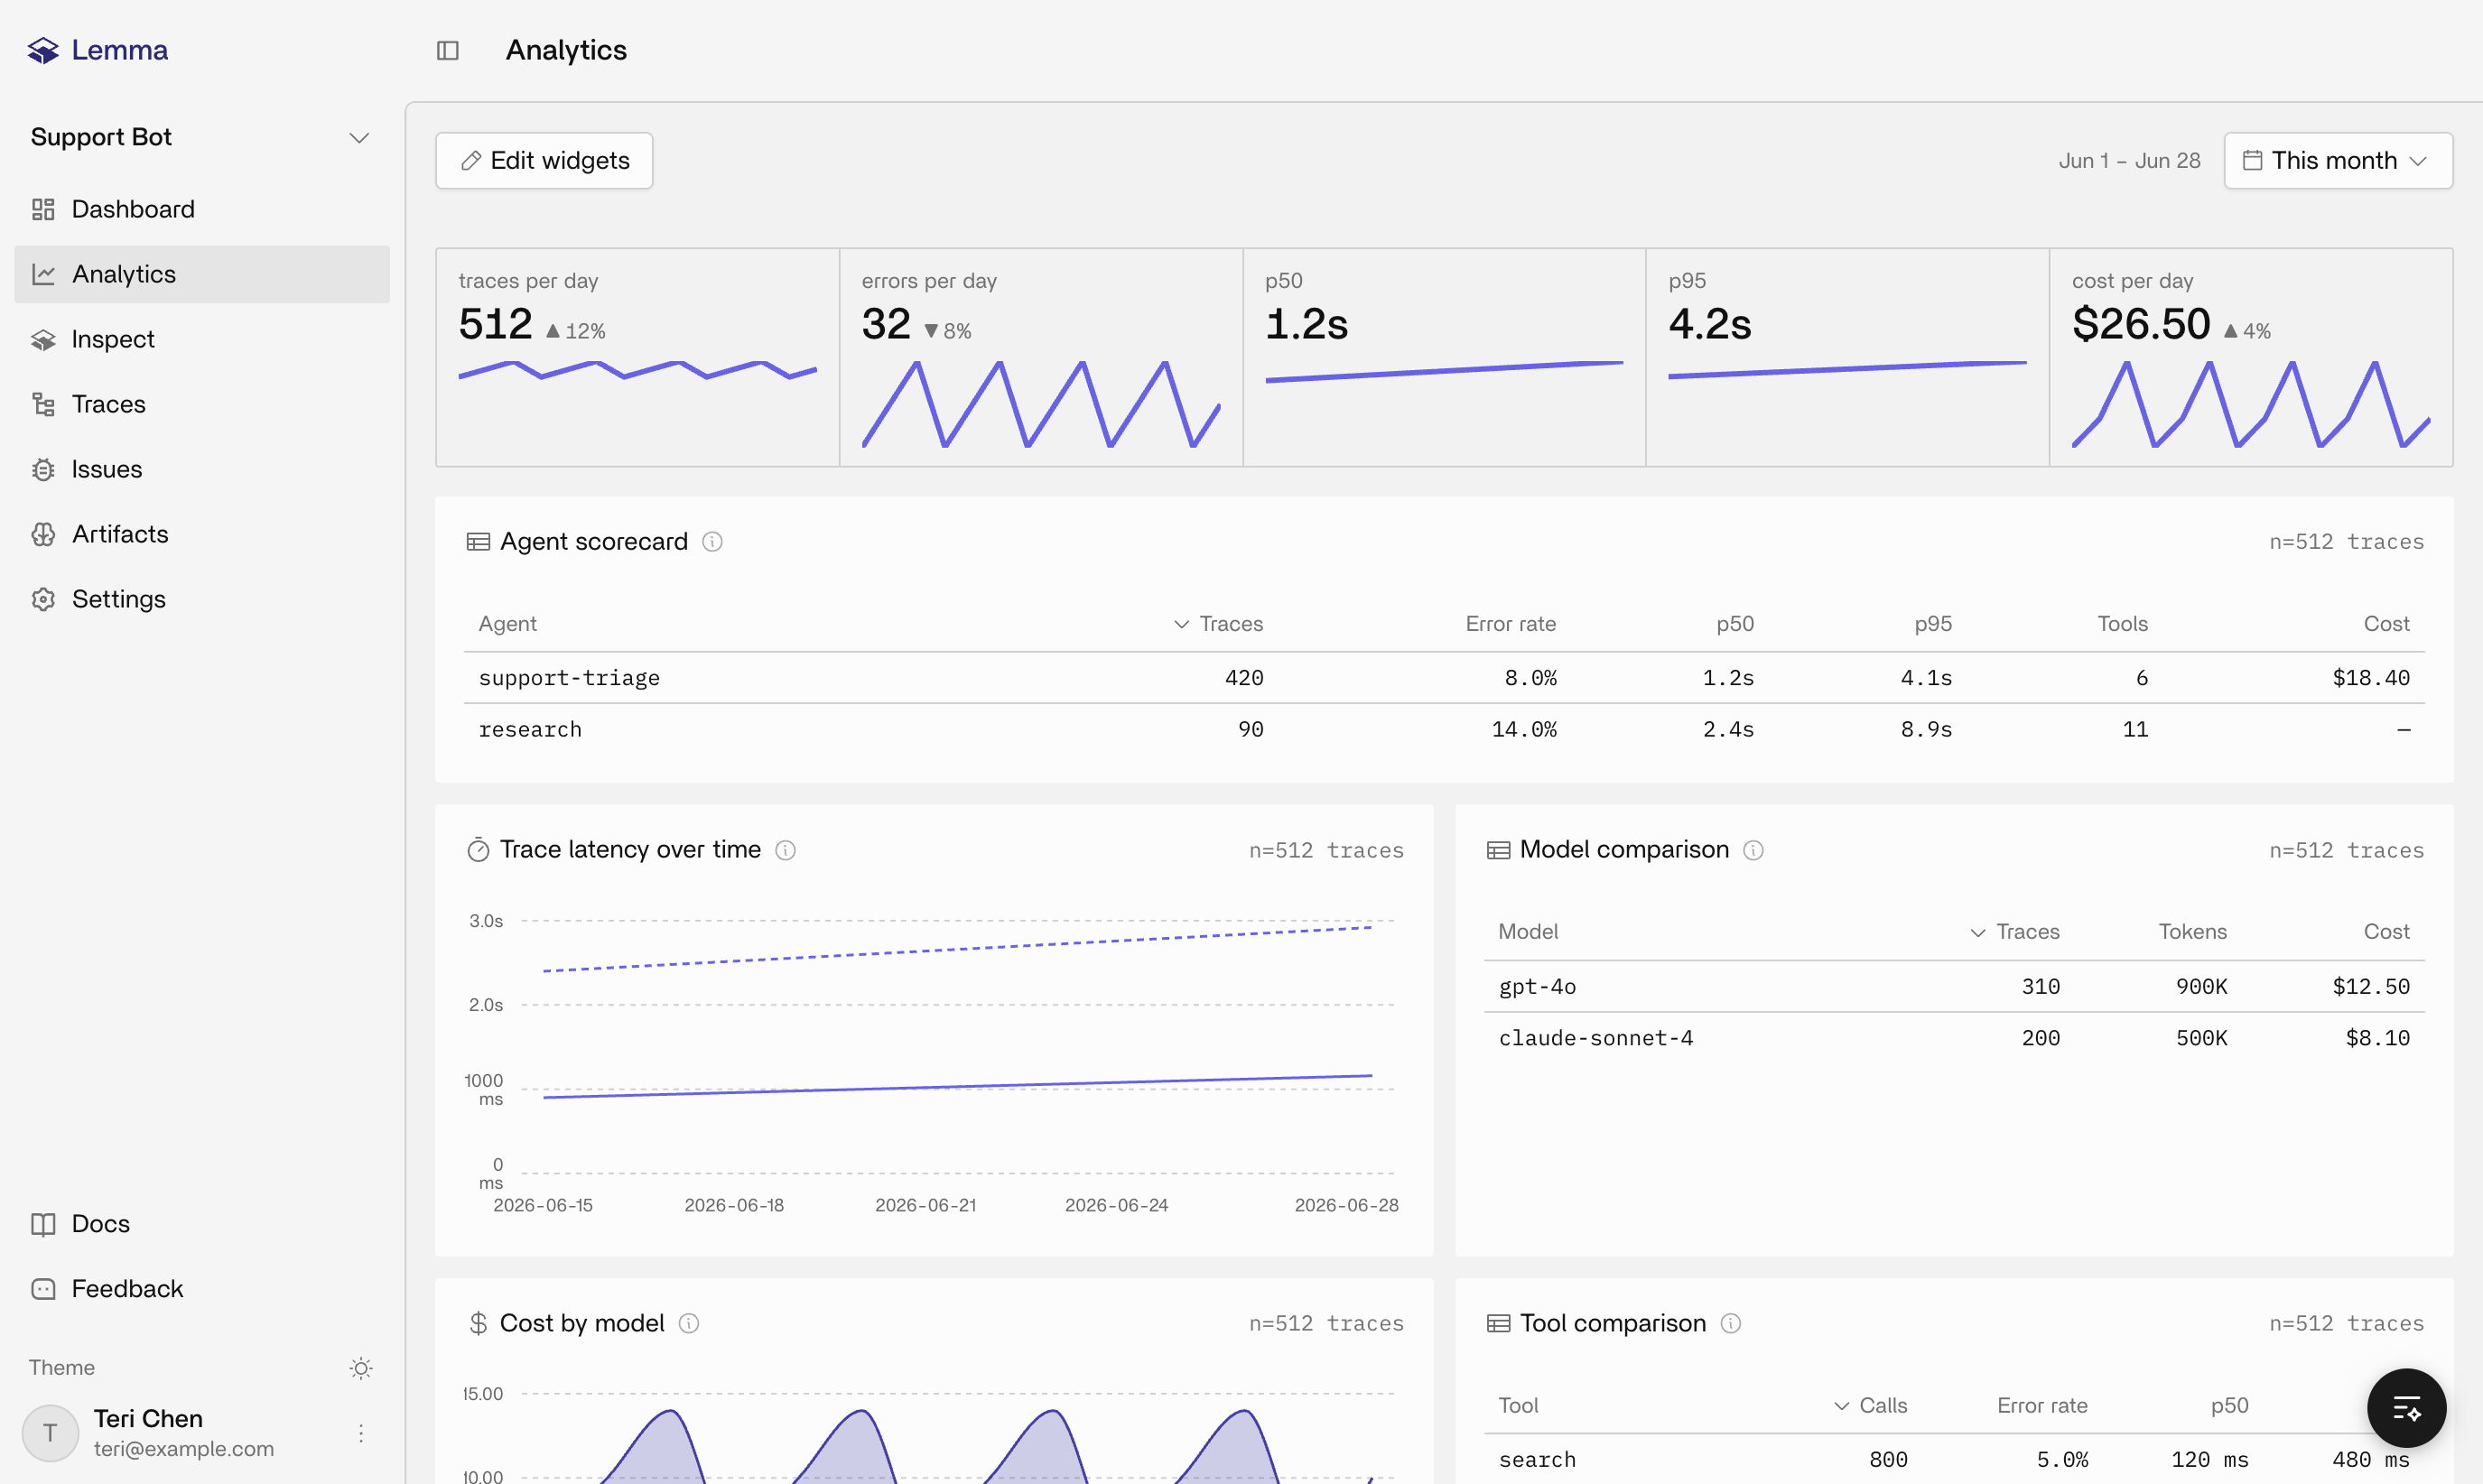
Headline stats for the window include trace count, errors, p50 and p95 end-to-end latency, and estimated cost, each with a period-over-period delta when the prior window still fits inside the 90-day horizon.
Below the headline stats, you can add, remove, and reorder widgets. Lemma only offers a widget once its required telemetry is present:
* **Agent scorecard**: volume, latency, error rate, tools, tokens, and cost per agent
* **Trace latency over time**: p50 and p95 latency plotted across the window
* **Model comparison**: generation volume, latency, error rate, tokens, and cost by model
* **Cost by model**: stacked estimated cost over time
* **Tool call volume**: stacked calls by tool
* **Tool comparison**: calls, latency, error rate, and share of traces by tool
* **Error rate**: root-span error rate over time
* **Tool error concentration**: tools ranked by failing proportion, linking into Traces
Cost figures are estimated model cost calculated from recorded usage, not a billed invoice. Lemma doesn't claim you were charged a specific amount on this page.
Empty and low-data states are expected, not a bug. A new project, a quiet agent, or traces missing model, tool, or cost fields will hide or zero the widgets that depend on that data. Send complete traces (see [Building high-quality traces](/guides/building-high-quality-traces) and [Analytics telemetry](/reference/analytics-telemetry)) before assuming an empty chart means an outage.
## From a trend to evidence
When a chart shows something worth investigating, open **[Traces](/platform/traces)** filtered to that window, and to the tool when the widget links there. If the failure looks recurring rather than a single spike, check **[Issues](/platform/issues)** instead. You can also ask **[Inspect](/platform/inspect)** window-aware questions directly on the Analytics page; it explains what the charts show rather than replacing them.
## Related pages
How traces, issues, Inspect, Artifacts, and Analytics fit together.
Open the executions behind a chart point.
Recurring failure patterns across many traces.
What the SDK must emit for widgets to populate.
## Timeframes and granularity
Pick a window: all time (clamped to the Analytics horizon), this week, this month, this quarter, this year, or a custom range. Lemma buckets the charts by day, week, or month, defaulting to whatever keeps them readable: day for a week or month window, week for a quarter, month for a year or all time.
Analytics only looks back 90 days on a rolling basis, so older data won't show even if you pick all time. Individual traces on the [Traces](/platform/traces) list are retained for 14 days, which means a chart point can represent a day whose raw traces have already aged out of that list. Use Analytics to see the trend and Traces to open the executions you can still read.
## Project and agent scope
Analytics is project-scoped, and the agent scorecard lists every agent that appeared in the window. Agent names come from the traces themselves, not from a registry you maintain elsewhere, so a missing agent means it didn't emit ready traces in this project and window, not that someone deleted it from a catalog.
## What the surface shows
Headline stats for the window include trace count, errors, p50 and p95 end-to-end latency, and estimated cost, each with a period-over-period delta when the prior window still fits inside the 90-day horizon.
Below the headline stats, you can add, remove, and reorder widgets. Lemma only offers a widget once its required telemetry is present:
* **Agent scorecard**: volume, latency, error rate, tools, tokens, and cost per agent
* **Trace latency over time**: p50 and p95 latency plotted across the window
* **Model comparison**: generation volume, latency, error rate, tokens, and cost by model
* **Cost by model**: stacked estimated cost over time
* **Tool call volume**: stacked calls by tool
* **Tool comparison**: calls, latency, error rate, and share of traces by tool
* **Error rate**: root-span error rate over time
* **Tool error concentration**: tools ranked by failing proportion, linking into Traces
Cost figures are estimated model cost calculated from recorded usage, not a billed invoice. Lemma doesn't claim you were charged a specific amount on this page.
Empty and low-data states are expected, not a bug. A new project, a quiet agent, or traces missing model, tool, or cost fields will hide or zero the widgets that depend on that data. Send complete traces (see [Building high-quality traces](/guides/building-high-quality-traces) and [Analytics telemetry](/reference/analytics-telemetry)) before assuming an empty chart means an outage.
## From a trend to evidence
When a chart shows something worth investigating, open **[Traces](/platform/traces)** filtered to that window, and to the tool when the widget links there. If the failure looks recurring rather than a single spike, check **[Issues](/platform/issues)** instead. You can also ask **[Inspect](/platform/inspect)** window-aware questions directly on the Analytics page; it explains what the charts show rather than replacing them.
## Related pages
How traces, issues, Inspect, Artifacts, and Analytics fit together.
Open the executions behind a chart point.
Recurring failure patterns across many traces.
What the SDK must emit for widgets to populate.